
Diversity and workforce dashboard
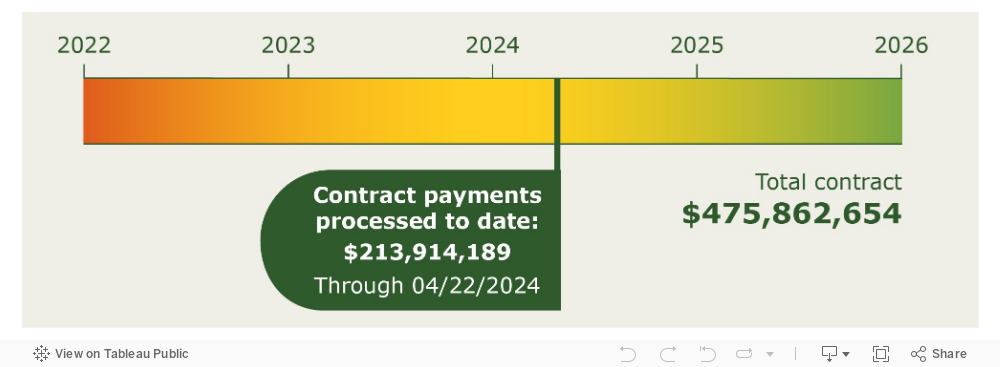
Timeline and budget spent
This dashboard shows the Abernethy Bridge Construction Project's progress toward its workforce and contractor diversity goals. It’s updated monthly. The prime contractor, Kiewit Infrastructure West Company, must make a good faith effort to meet these goals by the completion of the Abernethy Bridge construction project. ODOT meets with Kiewit monthly to review progress and identify opportunities for improvement where performance is falling short of the goal(s).
Dashboard last updated 2/12/2025 with payments processed through 2/5/2025.
Dashboard metrics
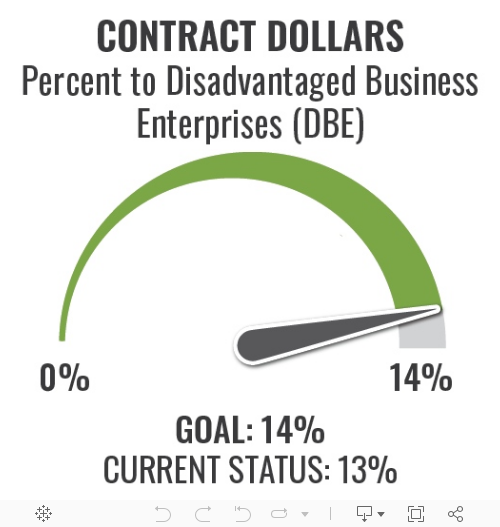
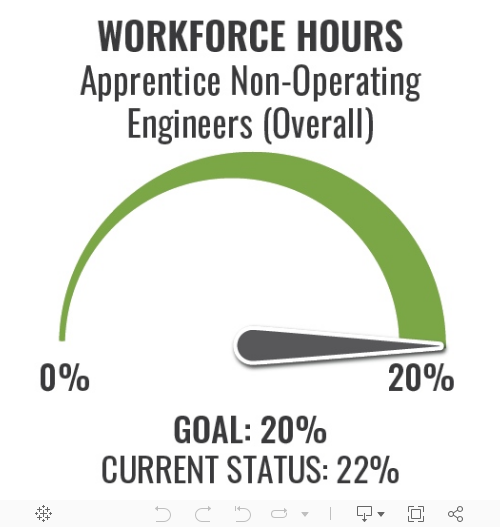
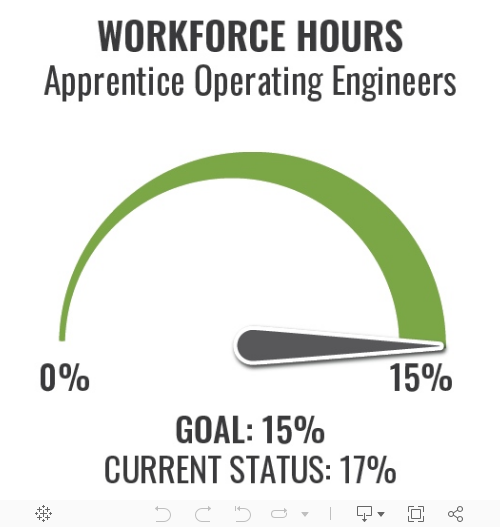
The gauges show status relative to payments processed to date. They will fluctuate monthly. Each goal will get a final evaluation after construction is complete.
ODOT is experiencing some difficulties with the database related to the Disadvantage Business Enterprise numbers and percentages. ODOT is repairing the database difficulties and will have the correct DBE project numbers and percentages by August 2025.

Disadvantaged Business Enterprises (DBEs)
ODOT is experiencing some difficulties with the database related to the Disadvantage Business Enterprise numbers and percentages. ODOT is repairing the database difficulties and will have the correct DBE project numbers and percentages by August 2025.
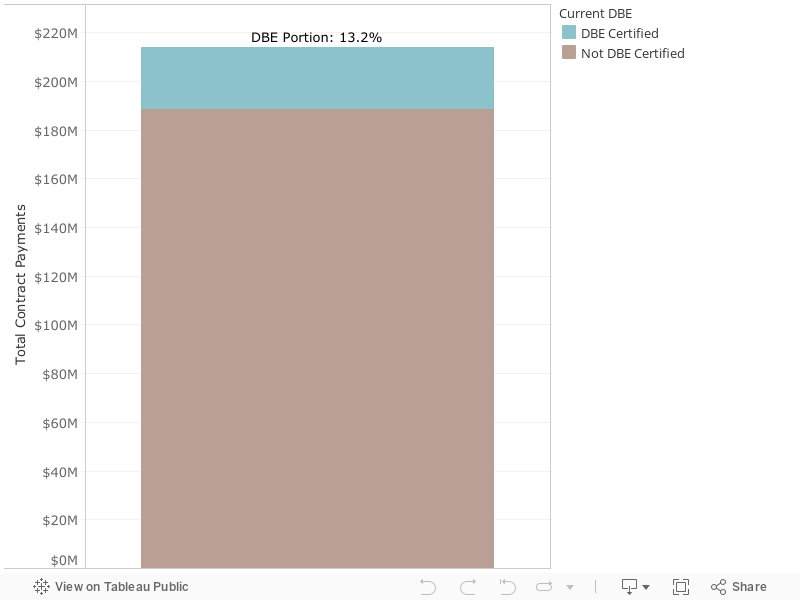
Payments to certified contractors to date
This shows progress toward the goal of 14% of total construction contract dollars paid to date certified DBEs by completion.*
Hover over columns to see dollars and percentages.
| Metric | Value |
|---|---|
| Total DBE Amount | $17,648,679.08 |
| Total Project Amount | $129,555,120.50 |
| Total DBE Percentage | 13.62% |
*Minorities (Blacks, Hispanics, Native Americans, Asian-Pacific Americans and Subcontinent Asian American), women, and other individuals on a case-by-case basis.
Visit ODOT’s DBE resource center for more information.
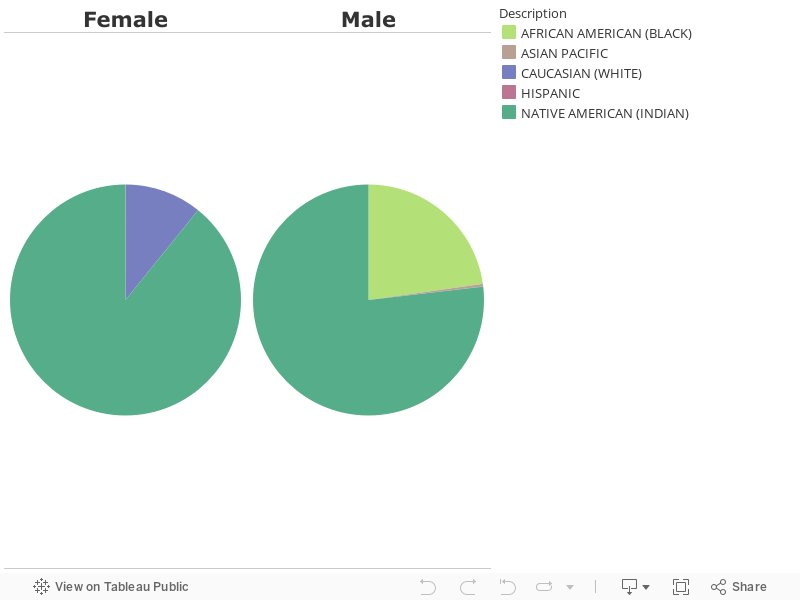
DBE-certified contractor payments: gender and race/ethnicity
This shows gender and detailed race/ethnicity for DBE contractor payments to date.
Hover over pie charts to see demographic insights.
| Owner Gender | Description | Payment Amount | Percent of Gender |
|---|---|---|---|
| Female | ASIAN PACIFIC | $3,500.00 | 0.1% |
| Female | CAUCASIAN (WHITE) | $481,716.96 | 7.1% |
| Female | HISPANIC | $33,573.24 | 0.5% |
| Female | NATIVE AMERICAN (INDIAN) | $6,234,202.56 | 92.3% |
| Male | AFRICAN AMERICAN (BLACK) | $827,188.85 | 8.5% |
| Male | ASIAN PACIFIC | $32,130.00 | 0.3% |
| Male | NATIVE AMERICAN (INDIAN) | $8,628,905.05 | 88.6% |
| Male | SUBCONTINENT ASIAN (ASIAN INDIAN) | $249,864.00 | 2.6% |
Apprenticeships
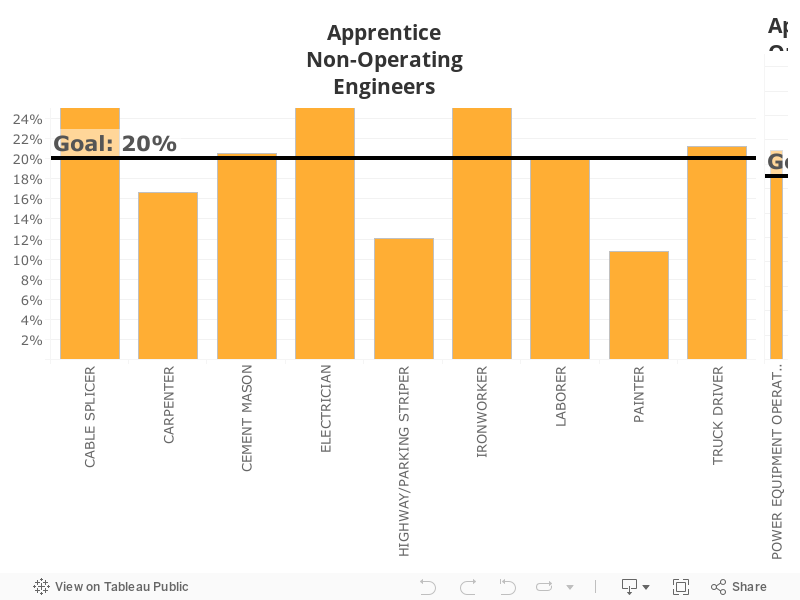
Monthly apprenticeship and on-the-job trainee (OJT) hours by trade
This shows progress toward apprenticeship/OJT goals of 15% of workforce hours for operating engineers and 20% of workforce hours for all other, non-operating engineer apprenticeable trades and crafts. Hours worked on subcontracts under $100,000 are exempt and excluded from measurement on this gauge.
See descriptions of Trades on the Oregon Bureau of Labor and Industries (BOLI) website: BOLI : Apprenticeship Trade Descriptions »
Hover over columns to see details.
| Description_y | Hours | Percentage Apprentice | |||
|---|---|---|---|---|---|
| Worker (W) Class | Apprentice | Journey Worker | Trainee | ||
| CARPENTER | 5527.00 | 41552.00 | 0 | 11.7% | |
| CEMENT MASON | 174.50 | 708.00 | 0 | 19.8% | |
| DIVER | 0.00 | 206.00 | 0 | 0.0% | |
| DIVER STANDBY | 0.00 | 191.00 | 0 | 0.0% | |
| DIVER TENDER | 0.00 | 396.00 | 0 | 0.0% | |
| ELECTRICIAN | 1262.50 | 1789.50 | 0 | 41.4% | |
| HIGHWAY/PARKING STRIPER | 31.75 | 253.75 | 0 | 11.1% | |
| IRONWORKER | 6393.00 | 10721.00 | 0 | 37.4% | |
| LABORER | 9985.42 | 38630.07 | 1080 | 20.5% | |
| PAINTER | 0.00 | 908.00 | 0 | 0.0% | |
| POWER EQUIPMENT OPERATOR | 12788.08 | 76807.80 | 0 | 14.3% | |
| TRUCK DRIVER | 0.00 | 1448.57 | 468 | 0.0% | |
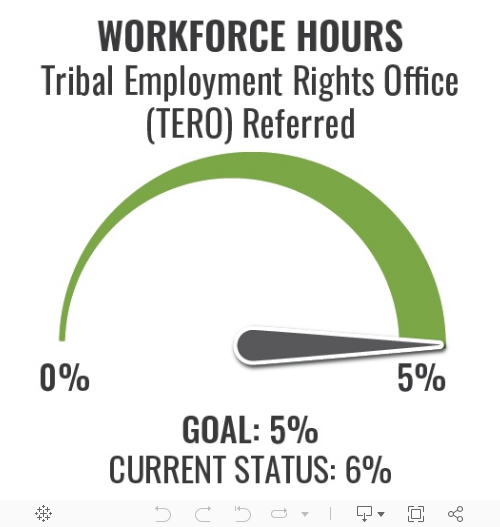
Tribal Employment Rights Office (TERO) hiring preference
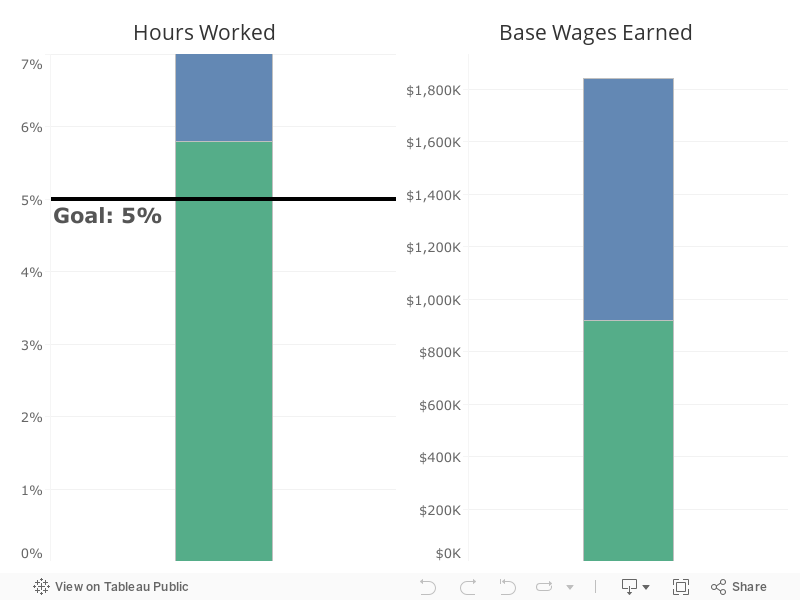
Hours and earnings for TERO-referred workers
This shows progress toward the project's Indian hire preference goal of 5%* of contract workforce hours.
The TERO Ordinance stipulates preference requirements in employment and contracting on or near the boundaries of the Grand Ronde Reservation. These preferences bring increased opportunity for jobs and other economic benefits for the social and cultural prosperity of the Grand Ronde Tribe. For more information, visit: TERO Confederated Tribes of Grand Ronde »
| Metric | Value |
|---|---|
| Total TERO Hours | 13974.7 |
| Total TERO Wages | $515,715.93 |
| Percent Hours TERO | 6.37% |
*The 5% hire preference goal can be met only with Grand Ronde Tribal Employment Rights Office (TERO) program referrals, but workers can be a member of any federally recognized tribe.
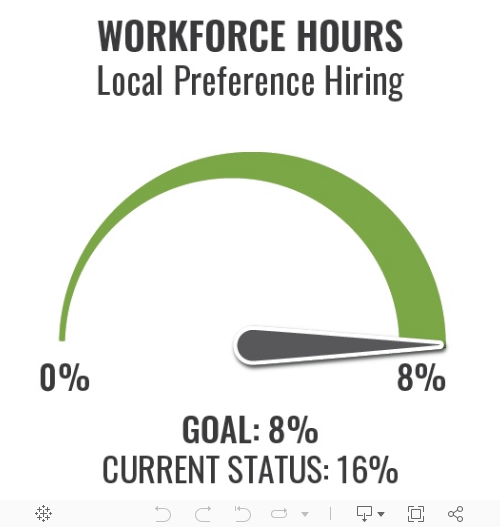
Local preference hiring
This means hiring workers from priority ZIP codes* in Clackamas, Multnomah, Washington and Marion counties within reasonable commuting distance of the project and with high concentrations of:
People living below 125% of the federal poverty line.
Unemployed people possessing knowledge, skills and abilities to perform the work.
People without a college degree.
Hours and earnings for all targeted ZIP codes
This shows progress toward the goal of 8% of contract workforce hours from local preference hiring of workers who live in priority ZIP codes*. Hours worked on subcontracts under $100,000 are exempt and excluded from measurement on this gauge.
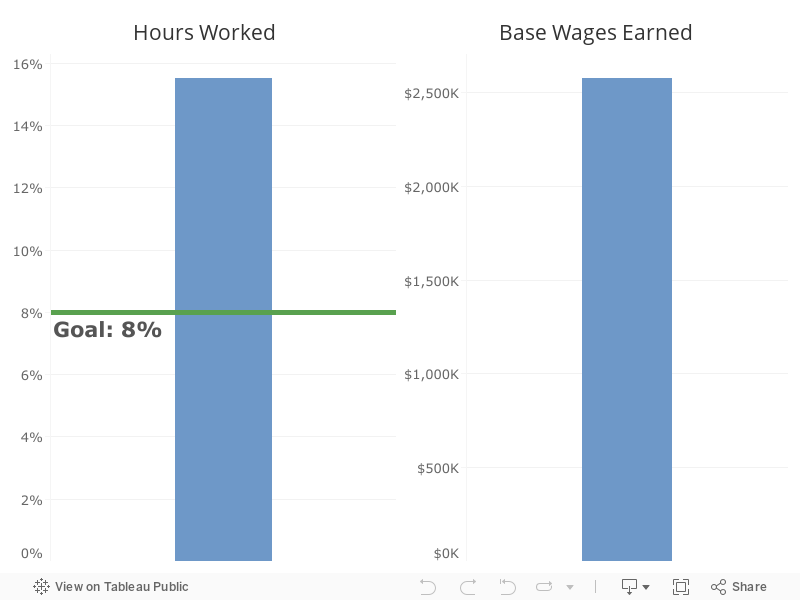
| Metric | Value |
|---|---|
| Total Priority Zip Hours | 32571.0 |
| Total Priority Zip Wages | $1,330,000.04 |
| Percent Hours Priority Zip | 15.13% |
*Priority zip codes: 97003, 97005, 97024, 97026, 97030, 97038, 97078, 97116, 97202, 97203, 97204, 97205, 97206, 97211, 97214, 97216, 97217, 97218, 97220, 97222, 97227, 97230, 97233, 97236, 97266, 97305, 97317, 97362 and 97383.
Hours and earnings per targeted zip codes
This shows total hours worked and payments made to local workers in priority ZIP codes.
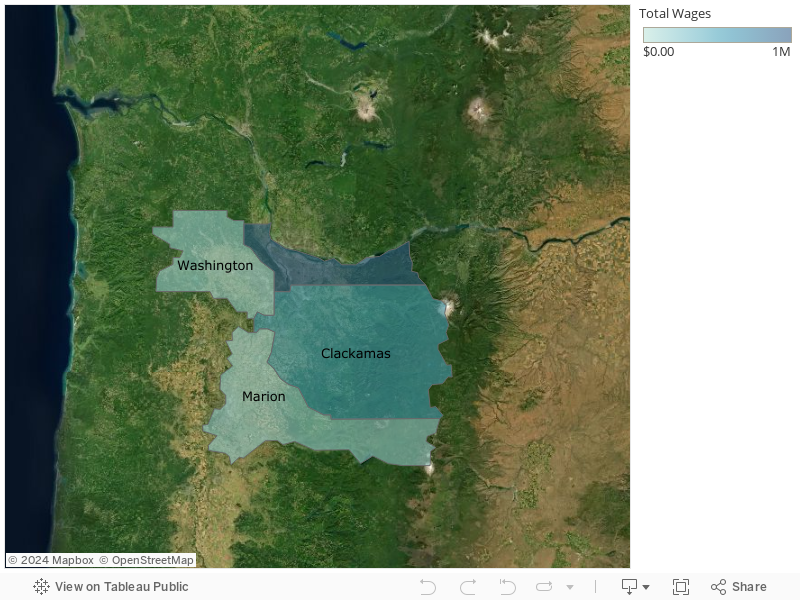
*Priority zip codes include: 97003, 97005, 97024, 97026, 97030, 97038, 97078, 97116, 97202, 97203, 97204, 97205, 97206, 97211, 97214, 97216, 97217, 97218, 97220, 97222, 97227, 97230, 97233, 97236, 97266, 97305, 97317, 97362 and 97383.
Additional demographic insights
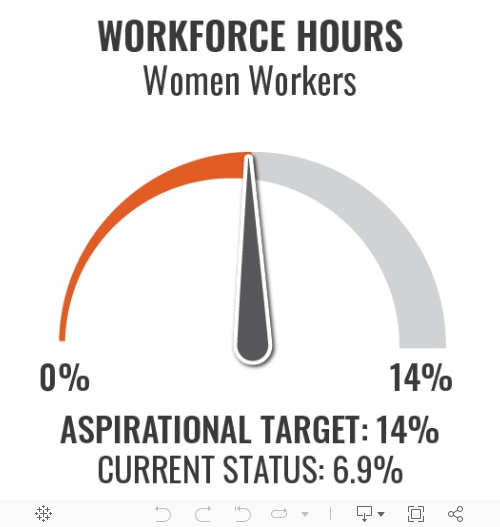
Women workforce hours and wages to date
This shows women workforce hours and wages to date. The project has an aspirational target of 14% of contractor hours worked by women.
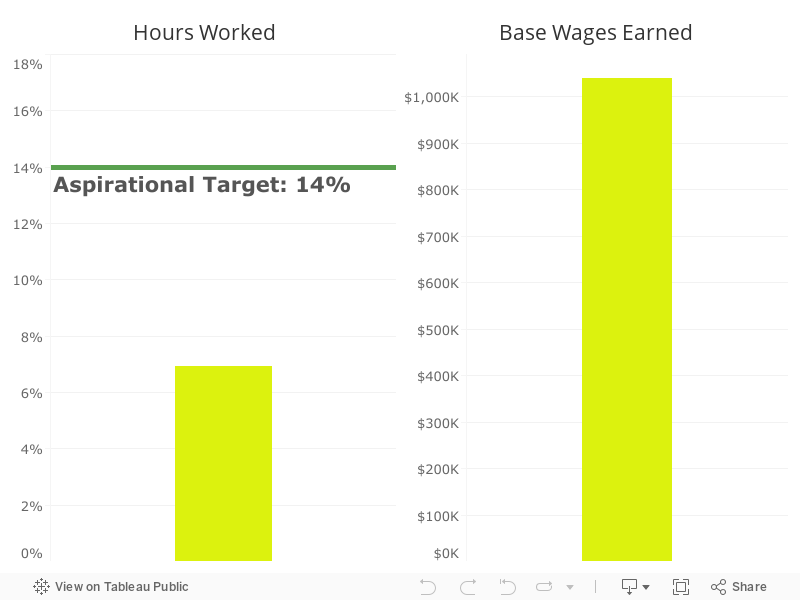
| Metric | Value |
|---|---|
| Total Women Hours | 12449.1 |
| Total Women Wages | $429,982.27 |
| Percent Hours Women | 5.67% |
Women workforce hours breakdown: race and ethnicity
Hover over the pie chart to see detailed race and ethnicity information for women workforce hours.
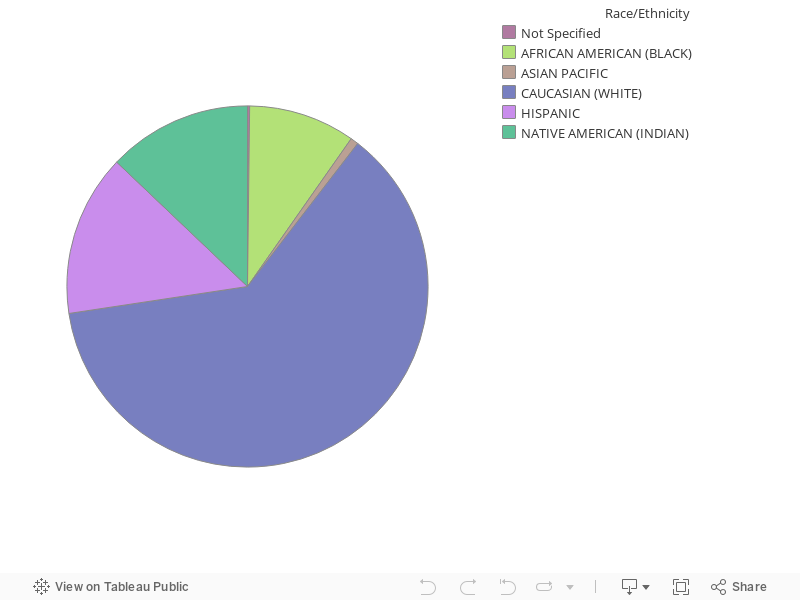
| Race/Ethnicity | Hours | Percent Hours of Ethnicity |
|---|---|---|
| AFRICAN AMERICAN (BLACK) | 1198.75 | 9.6% |
| CAUCASIAN (WHITE) | 7821.24 | 62.8% |
| HISPANIC | 1710.00 | 13.7% |
| NATIVE AMERICAN (INDIAN) | 1707.09 | 13.7% |
| UNKNOWN -NOT PROVIDED | 12.00 | 0.1% |
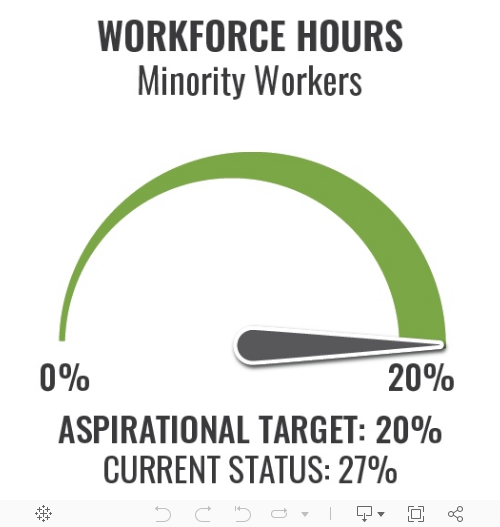
Minority workforce hours and wages to-date
This shows minority workforce hours and wages to date. The project has an aspirational target of 20% of contractor hours worked by minorities.
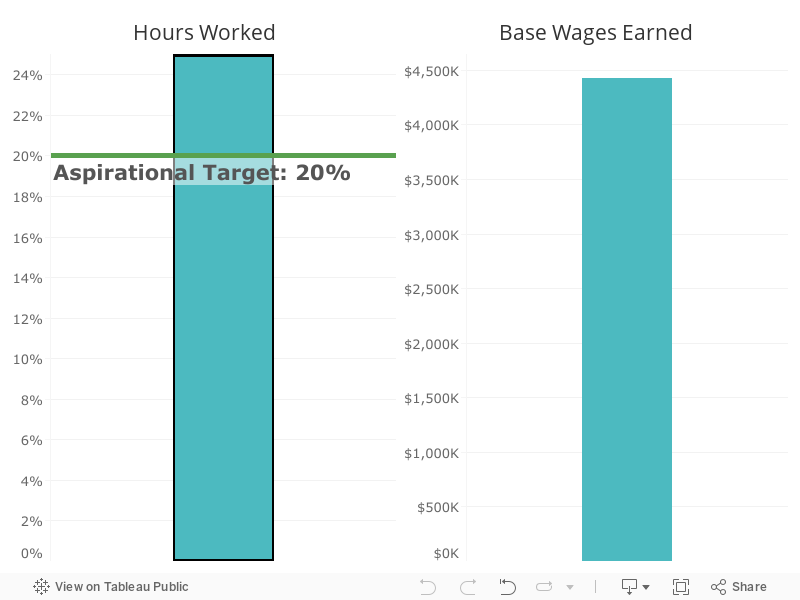
| Metric | Value |
|---|---|
| Total Minority Hours | 54121.4 |
| Total Minority Wages | $2,136,188.12 |
| Percent Hours Minority | 24.65% |
Minority workforce hours breakdown: race and ethnicity
Hover over pie chart to see detailed race and ethnicity information for minority workforce hours.
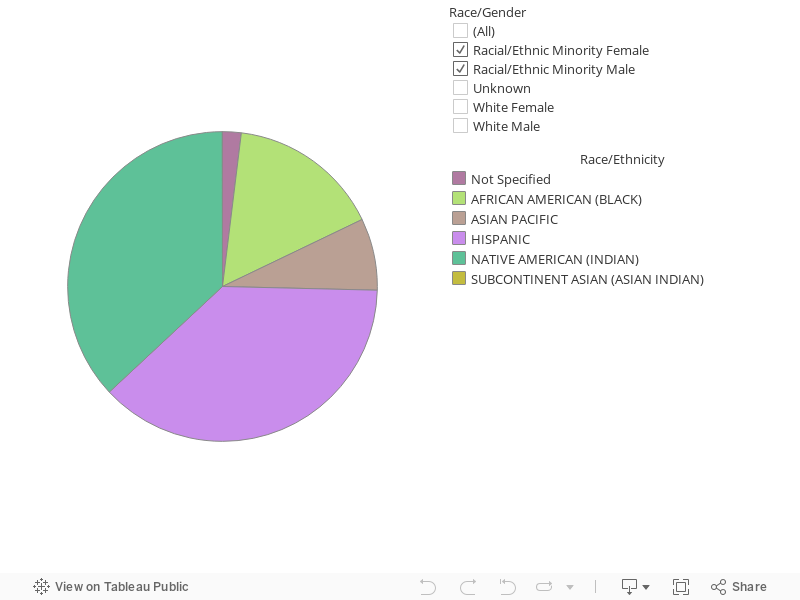
| Race/Ethnicity | Hours | Percent Hours of Ethnicity |
|---|---|---|
| AFRICAN AMERICAN (BLACK) | 7914.02 | 14.8% |
| ASIAN PACIFIC | 2722.33 | 5.1% |
| HISPANIC | 22777.06 | 42.6% |
| NATIVE AMERICAN (INDIAN) | 20048.97 | 37.5% |
| SUBCONTINENT ASIAN (ASIAN INDIAN) | 11.00 | 0.0% |
Workforce Hours include all eligible work performed by Apprentices, On-the-Job (OJT) workers, and Journey Level workers.
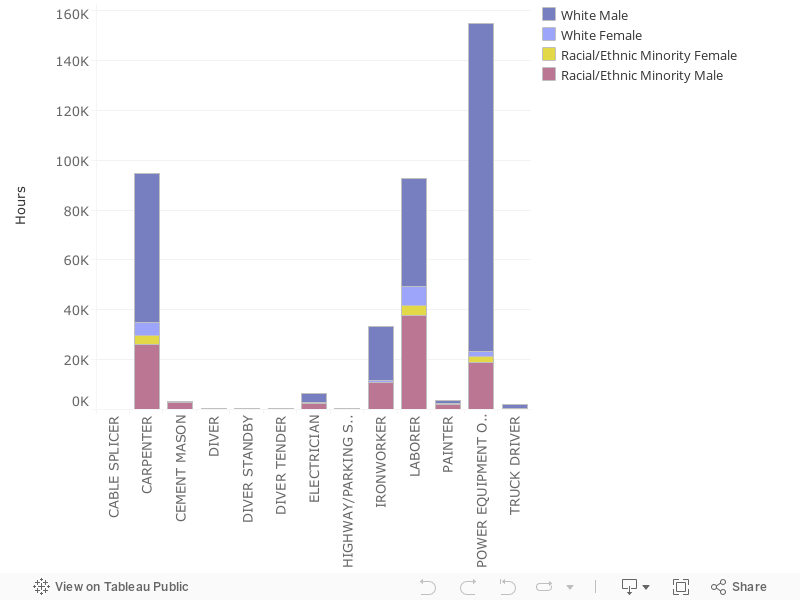
Workforce hours by trade: gender and race/ethnicity breakdown
This shows hours worked per trade by minority and gender status to date.
Hover over each column for more information.
| Trade | Worker (W) Class | Gender and Race | Hours | Percent |
|---|---|---|---|---|
| CARPENTER | Apprentice | Racial/Ethnic Minority Male | 1679.50 | 30.4% |
| CARPENTER | Apprentice | White Female | 106.00 | 1.9% |
| CARPENTER | Apprentice | White Male | 3741.50 | 67.7% |
| CARPENTER | Journey Worker | Racial/Ethnic Minority Female | 818.00 | 2.1% |
| CARPENTER | Journey Worker | Racial/Ethnic Minority Male | 9525.75 | 24.5% |
| CARPENTER | Journey Worker | White Female | 1172.00 | 3.0% |
| CARPENTER | Journey Worker | White Male | 27427.75 | 70.4% |
| CEMENT MASON | Apprentice | Racial/Ethnic Minority Male | 174.50 | 100.0% |
| CEMENT MASON | Journey Worker | Racial/Ethnic Minority Male | 612.00 | 86.4% |
| CEMENT MASON | Journey Worker | White Male | 96.00 | 13.6% |
| DIVER | Journey Worker | White Male | 198.00 | 100.0% |
| DIVER STANDBY | Journey Worker | Racial/Ethnic Minority Male | 4.00 | 2.1% |
| DIVER STANDBY | Journey Worker | White Female | 4.00 | 2.1% |
| DIVER STANDBY | Journey Worker | White Male | 183.00 | 95.8% |
| DIVER TENDER | Journey Worker | White Female | 6.00 | 1.5% |
| DIVER TENDER | Journey Worker | White Male | 388.00 | 98.5% |
| ELECTRICIAN | Apprentice | Racial/Ethnic Minority Male | 1204.00 | 95.4% |
| ELECTRICIAN | Apprentice | White Female | 37.50 | 3.0% |
| ELECTRICIAN | Apprentice | White Male | 21.00 | 1.7% |
| ELECTRICIAN | Journey Worker | Racial/Ethnic Minority Male | 29.00 | 1.6% |
| ELECTRICIAN | Journey Worker | White Male | 1760.50 | 98.4% |
| HIGHWAY/PARKING STRIPER | Apprentice | Racial/Ethnic Minority Male | 18.00 | 56.7% |
| HIGHWAY/PARKING STRIPER | Apprentice | White Male | 13.75 | 43.3% |
| HIGHWAY/PARKING STRIPER | Journey Worker | Racial/Ethnic Minority Male | 42.25 | 16.7% |
| HIGHWAY/PARKING STRIPER | Journey Worker | White Male | 211.50 | 83.3% |
| IRONWORKER | Apprentice | Racial/Ethnic Minority Male | 3101.00 | 48.5% |
| IRONWORKER | Apprentice | White Female | 182.50 | 2.9% |
| IRONWORKER | Apprentice | White Male | 3109.50 | 48.6% |
| IRONWORKER | Journey Worker | Racial/Ethnic Minority Male | 3352.00 | 33.0% |
| IRONWORKER | Journey Worker | White Male | 6818.00 | 67.0% |
| LABORER | Apprentice | Racial/Ethnic Minority Female | 769.50 | 7.8% |
| LABORER | Apprentice | Racial/Ethnic Minority Male | 3585.12 | 36.3% |
| LABORER | Apprentice | White Female | 1854.75 | 18.8% |
| LABORER | Apprentice | White Male | 3677.28 | 37.2% |
| LABORER | Journey Worker | Racial/Ethnic Minority Female | 1473.52 | 4.0% |
| LABORER | Journey Worker | Racial/Ethnic Minority Male | 15505.86 | 42.4% |
| LABORER | Journey Worker | White Female | 2708.46 | 7.4% |
| LABORER | Journey Worker | White Male | 16885.38 | 46.2% |
| LABORER | Trainee | White Female | 299.00 | 27.7% |
| LABORER | Trainee | White Male | 781.00 | 72.3% |
| PAINTER | Journey Worker | Racial/Ethnic Minority Male | 615.00 | 67.7% |
| PAINTER | Journey Worker | White Male | 293.00 | 32.3% |
| POWER EQUIPMENT OPERATOR | Apprentice | Racial/Ethnic Minority Female | 1496.00 | 11.7% |
| POWER EQUIPMENT OPERATOR | Apprentice | Racial/Ethnic Minority Male | 1108.77 | 8.7% |
| POWER EQUIPMENT OPERATOR | Apprentice | White Female | 693.50 | 5.4% |
| POWER EQUIPMENT OPERATOR | Apprentice | White Male | 9463.81 | 74.2% |
| POWER EQUIPMENT OPERATOR | Journey Worker | Racial/Ethnic Minority Female | 58.82 | 0.1% |
| POWER EQUIPMENT OPERATOR | Journey Worker | Racial/Ethnic Minority Male | 6508.79 | 9.2% |
| POWER EQUIPMENT OPERATOR | Journey Worker | White Female | 290.78 | 0.4% |
| POWER EQUIPMENT OPERATOR | Journey Worker | White Male | 64223.37 | 90.4% |
| TRUCK DRIVER | Journey Worker | Racial/Ethnic Minority Male | 38.75 | 2.7% |
| TRUCK DRIVER | Journey Worker | White Female | 0.75 | 0.1% |
| TRUCK DRIVER | Journey Worker | White Male | 1409.07 | 97.3% |
| TRUCK DRIVER | Trainee | White Female | 448.00 | 95.7% |
| TRUCK DRIVER | Trainee | White Male | 20.00 | 4.3% |
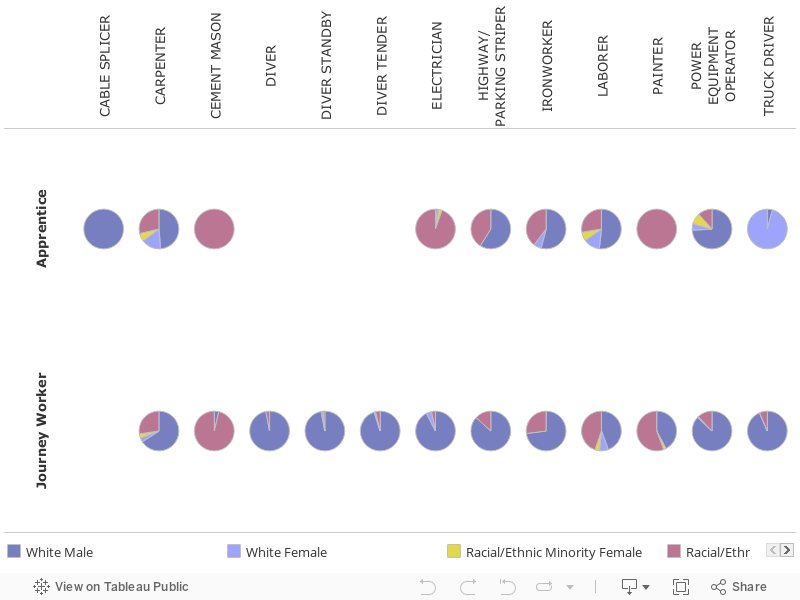
Proportion of workforce trade hours by minority and gender status
This shows the proportion of hours worked per trade by minority and gender status to date. Also see the breakdown between apprentices and on-the-job trainees vs. journey-level workers.
Hover over each pie chart for more information.
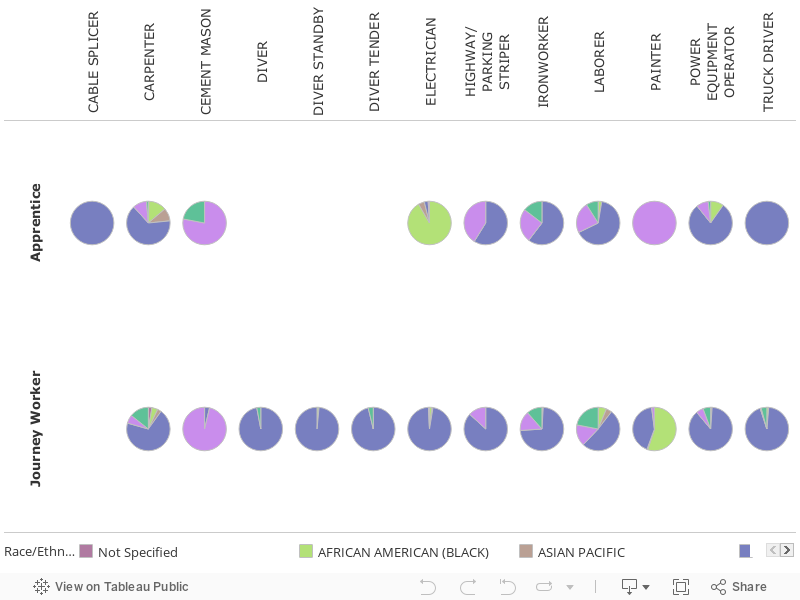
Total workforce hours by trade: race and ethnicity detail
This shows more insights into race and ethnicity of worker hours per trade. Also see the breakdown between apprentices and on-the-job trainees vs. journey-level workers.
Hover over each pie chart for more information.
| Trade | Worker (W) Class | Race/Ethnicity | Hours | Percent |
|---|---|---|---|---|
| CARPENTER | Apprentice | ASIAN PACIFIC | 20.00 | 0.4% |
| CARPENTER | Apprentice | CAUCASIAN (WHITE) | 3847.50 | 69.6% |
| CARPENTER | Apprentice | HISPANIC | 1440.00 | 26.1% |
| CARPENTER | Apprentice | NATIVE AMERICAN (INDIAN) | 219.50 | 4.0% |
| CARPENTER | Journey Worker | AFRICAN AMERICAN (BLACK) | 1814.50 | 4.4% |
| CARPENTER | Journey Worker | ASIAN PACIFIC | 1786.50 | 4.4% |
| CARPENTER | Journey Worker | CAUCASIAN (WHITE) | 28599.75 | 69.9% |
| CARPENTER | Journey Worker | HISPANIC | 2962.75 | 7.2% |
| CARPENTER | Journey Worker | NATIVE AMERICAN (INDIAN) | 3132.00 | 7.7% |
| CARPENTER | Journey Worker | UNKNOWN -NOT PROVIDED | 2608.50 | 6.4% |
| CEMENT MASON | Apprentice | HISPANIC | 174.50 | 100.0% |
| CEMENT MASON | Journey Worker | CAUCASIAN (WHITE) | 96.00 | 13.6% |
| CEMENT MASON | Journey Worker | HISPANIC | 612.00 | 86.4% |
| DIVER | Journey Worker | CAUCASIAN (WHITE) | 198.00 | 96.1% |
| DIVER | Journey Worker | UNKNOWN -NOT PROVIDED | 8.00 | 3.9% |
| DIVER STANDBY | Journey Worker | AFRICAN AMERICAN (BLACK) | 4.00 | 2.1% |
| DIVER STANDBY | Journey Worker | CAUCASIAN (WHITE) | 187.00 | 97.9% |
| DIVER TENDER | Journey Worker | CAUCASIAN (WHITE) | 394.00 | 99.5% |
| DIVER TENDER | Journey Worker | UNKNOWN -NOT PROVIDED | 2.00 | 0.5% |
| ELECTRICIAN | Apprentice | AFRICAN AMERICAN (BLACK) | 1179.00 | 93.4% |
| ELECTRICIAN | Apprentice | CAUCASIAN (WHITE) | 58.50 | 4.6% |
| ELECTRICIAN | Apprentice | HISPANIC | 25.00 | 2.0% |
| ELECTRICIAN | Journey Worker | AFRICAN AMERICAN (BLACK) | 7.50 | 0.4% |
| ELECTRICIAN | Journey Worker | CAUCASIAN (WHITE) | 1760.50 | 98.4% |
| ELECTRICIAN | Journey Worker | HISPANIC | 10.50 | 0.6% |
| ELECTRICIAN | Journey Worker | SUBCONTINENT ASIAN (ASIAN INDIAN) | 11.00 | 0.6% |
| HIGHWAY/PARKING STRIPER | Apprentice | CAUCASIAN (WHITE) | 13.75 | 43.3% |
| HIGHWAY/PARKING STRIPER | Apprentice | HISPANIC | 18.00 | 56.7% |
| HIGHWAY/PARKING STRIPER | Journey Worker | CAUCASIAN (WHITE) | 211.50 | 83.3% |
| HIGHWAY/PARKING STRIPER | Journey Worker | HISPANIC | 42.25 | 16.7% |
| IRONWORKER | Apprentice | AFRICAN AMERICAN (BLACK) | 4.00 | 0.1% |
| IRONWORKER | Apprentice | CAUCASIAN (WHITE) | 3292.00 | 51.5% |
| IRONWORKER | Apprentice | HISPANIC | 2223.50 | 34.8% |
| IRONWORKER | Apprentice | NATIVE AMERICAN (INDIAN) | 873.50 | 13.7% |
| IRONWORKER | Journey Worker | AFRICAN AMERICAN (BLACK) | 123.00 | 1.1% |
| IRONWORKER | Journey Worker | ASIAN PACIFIC | 38.00 | 0.4% |
| IRONWORKER | Journey Worker | CAUCASIAN (WHITE) | 6818.00 | 63.6% |
| IRONWORKER | Journey Worker | HISPANIC | 2039.00 | 19.0% |
| IRONWORKER | Journey Worker | NATIVE AMERICAN (INDIAN) | 1152.00 | 10.7% |
| IRONWORKER | Journey Worker | UNKNOWN -NOT PROVIDED | 551.00 | 5.1% |
| LABORER | Apprentice | AFRICAN AMERICAN (BLACK) | 351.50 | 3.5% |
| LABORER | Apprentice | CAUCASIAN (WHITE) | 5532.03 | 55.4% |
| LABORER | Apprentice | HISPANIC | 3254.25 | 32.6% |
| LABORER | Apprentice | NATIVE AMERICAN (INDIAN) | 748.87 | 7.5% |
| LABORER | Apprentice | UNKNOWN -NOT PROVIDED | 98.77 | 1.0% |
| LABORER | Journey Worker | AFRICAN AMERICAN (BLACK) | 2066.25 | 5.3% |
| LABORER | Journey Worker | ASIAN PACIFIC | 49.50 | 0.1% |
| LABORER | Journey Worker | CAUCASIAN (WHITE) | 19593.84 | 50.7% |
| LABORER | Journey Worker | HISPANIC | 4448.95 | 11.5% |
| LABORER | Journey Worker | NATIVE AMERICAN (INDIAN) | 10414.68 | 27.0% |
| LABORER | Journey Worker | UNKNOWN -NOT PROVIDED | 2056.85 | 5.3% |
| LABORER | Trainee | CAUCASIAN (WHITE) | 1080.00 | 100.0% |
| PAINTER | Journey Worker | AFRICAN AMERICAN (BLACK) | 615.00 | 67.7% |
| PAINTER | Journey Worker | CAUCASIAN (WHITE) | 293.00 | 32.3% |
| POWER EQUIPMENT OPERATOR | Apprentice | AFRICAN AMERICAN (BLACK) | 1699.27 | 13.3% |
| POWER EQUIPMENT OPERATOR | Apprentice | CAUCASIAN (WHITE) | 10157.31 | 79.4% |
| POWER EQUIPMENT OPERATOR | Apprentice | HISPANIC | 550.00 | 4.3% |
| POWER EQUIPMENT OPERATOR | Apprentice | NATIVE AMERICAN (INDIAN) | 355.50 | 2.8% |
| POWER EQUIPMENT OPERATOR | Apprentice | UNKNOWN -NOT PROVIDED | 26.00 | 0.2% |
| POWER EQUIPMENT OPERATOR | Journey Worker | AFRICAN AMERICAN (BLACK) | 44.50 | 0.1% |
| POWER EQUIPMENT OPERATOR | Journey Worker | ASIAN PACIFIC | 671.33 | 0.9% |
| POWER EQUIPMENT OPERATOR | Journey Worker | CAUCASIAN (WHITE) | 64514.15 | 84.0% |
| POWER EQUIPMENT OPERATOR | Journey Worker | HISPANIC | 2723.36 | 3.5% |
| POWER EQUIPMENT OPERATOR | Journey Worker | NATIVE AMERICAN (INDIAN) | 3128.42 | 4.1% |
| POWER EQUIPMENT OPERATOR | Journey Worker | UNKNOWN -NOT PROVIDED | 5726.04 | 7.5% |
| TRUCK DRIVER | Journey Worker | AFRICAN AMERICAN (BLACK) | 1.00 | 0.1% |
| TRUCK DRIVER | Journey Worker | CAUCASIAN (WHITE) | 1409.82 | 97.3% |
| TRUCK DRIVER | Journey Worker | HISPANIC | 13.25 | 0.9% |
| TRUCK DRIVER | Journey Worker | NATIVE AMERICAN (INDIAN) | 24.50 | 1.7% |
| TRUCK DRIVER | Trainee | CAUCASIAN (WHITE) | 468.00 | 100.0% |
Local preference hiring
ODOT applied to the Federal Highway Administration to participate in a pilot program that allows for local hiring preference. The program helps states, local communities and the construction industry by allowing contracting agencies to use hiring preferences and/or innovative contracting approaches not otherwise authorized by law.
View a PowerPoint about our application »
Pilot program information: Federal Register—Enhancing Highway Workforce Development Opportunities Contracting Initiative »
Potential DBE construction opportunities
ODOT has identified over 100 potential DBEs and small business construction opportunities for this project. Interested DBEs should contact Kiewit Infrastructure West Company.
DBE/workforce development approach
ODOT encourages DBEs to participate in this project. We’re taking steps to position these businesses for success and enable the project to serve as a pipeline for future minority workers.
We hosted “Meet the Primes” matchmaking DBE events.
We worked with Kiewit Infrastructure West Company to provide small business capacity building, technical assistance and performance metrics.
Visit DBE resource center for more information.
Past materials and outreach
We hosted networking sessions for DBE and workforce providers to meet with potential prime contractors. We talked about this project and other upcoming ODOT construction projects.